Office Access Control Data Chronicles Broad Adoption of Work-From-Home Policies in Key U.S. Metro Areas

We are over a month into our nationwide work-from-home mandates. In major U.S. cities, it appears most of America’s urban commercial office workforce is holding the line on remote work. The aggregate office access data from Kastle Systems’ over 41,000 customers (that includes 1.3 million office workers) in U.S. metro areas confirms the decline in office attendance, based on daily entries into office buildings.
There are notable parallels between coronavirus developments over the last two months and the decline of office entries.
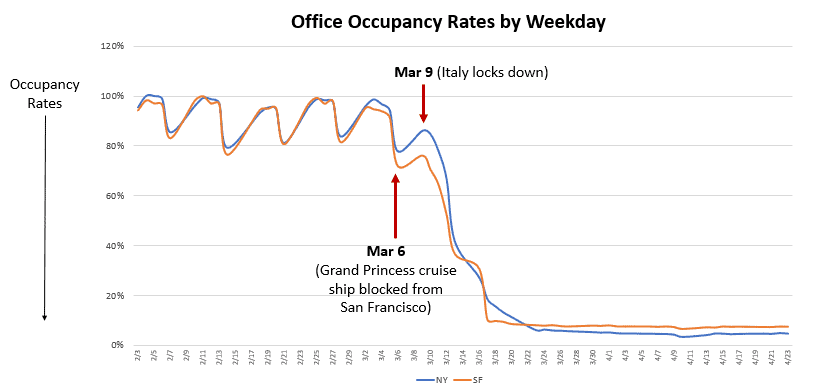
Beginning March 3, Kastle recorded the earliest signs of significant decreases in office access entries in San Francisco. This coincided with the earliest reported U.S. deaths from Covid-19 in the Seattle area. The first reported case in the U.S. was in January at the University of California, Davis, an hour’s drive north of San Francisco. Consequently, residents of the San Francisco Bay Area had high awareness of Covid-19’s presence earlier than residents in other metro areas.
The decrease in office entry in San Francisco accelerated starting March 6. That coincided with the Grand Princess cruise ship, which had 21 virus cases reported onboard, being held from docking in San Francisco.
Three days later, on March 9, Italy locked down the entire country as the Italian death toll topped 1,000. New York workplace admissions started falling, perhaps fearing sensitivity to European travel.
Then on March 11, President Trump announced a European travel ban, and the World Health Organization declared the Coronavirus a world pandemic. In lock step, office entries in Chicago, Metro Washington DC, and Austin plummeted by 45% to 70% over the next 3 business days.
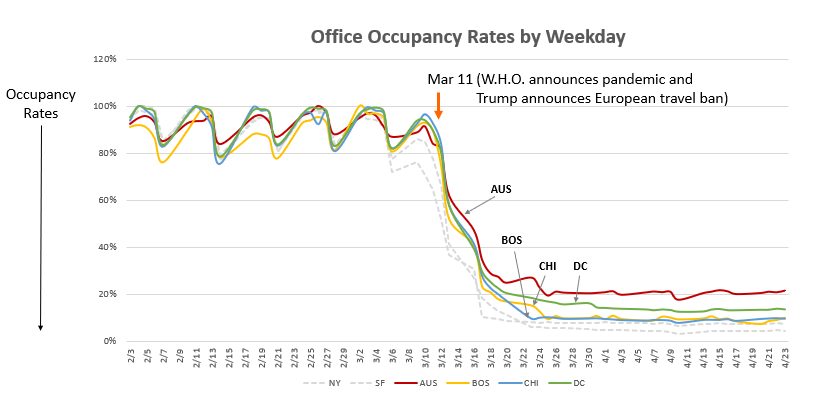
Showing a similar reaction timeframe, but perhaps less depth of concern, entries in Dallas, Houston, and Los Angeles fell 15-25% over that same period, but still stayed within 40-50% of their typical access levels.
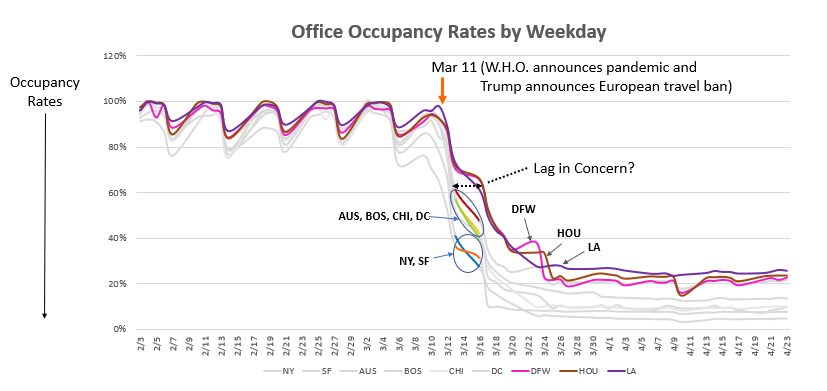
The more densely populated, public-transit dependent cities of San Francisco, New York and Chicago have continued to drift down in access rates to well below 20% of their average patterns – the first two falling below 10%. While Washington, D.C. also fits this profile, its office entries have held a bit higher at access rates around 25% of normal levels. That might be because so many of the capital-area offices are federal and military facilities with a larger share of occupants deemed to be essential workers.
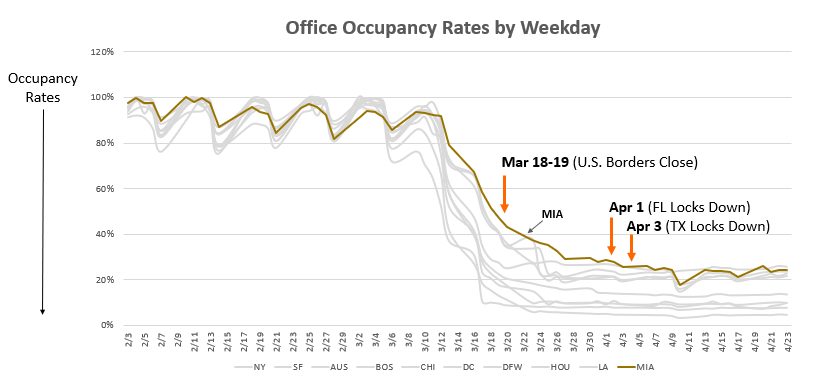
The beach-centric metro of Miami looks a bit more laid back and less concerned with Covid-19 for the first few weeks of the work-from-home measures. Their office access rates remained at almost 50% even as late as March 19-20 as the U.S. closed or partially closed its Canadian and Mexican borders.
Between April 1st and 3rd, states like Florida and Texas finally announced stay-at-home guidelines and Dallas, Houston and even Miami subsequently all dropped to below 25% of normal office access levels.
This data reflects the story of much of the nation’s workforce during this pandemic journey to date. the While some metros have taken longer to act, in less than a month., Americans in cities across the U.S. that are served by Kastle Systems dramatically embraced work from home guidelines. The overall national average of office entry levels dropped to just 15% of typical levels, as property owners and their tenants plan the likely more gradual slope back to a new normal.